This custom PyQt5/PySide2-compatible widget provides a frequency visualizer output for audio applications. It is completely configurable from the number of bars, the number of segments and colours to the animated decay. It's ready to drop into your Python-Qt5 applications.
The download package includes a demo animation using random data and some custom colour configuration so you can explore how the widget works.
Basic setup
To create an Equalizer object pass in the number of bars and a number of segments per bar.
equalizer = Equalizer(5, 10)
 The default appearance of the widget.
The default range for each of the equalizer bars is 0...100. This can be adjusted using .setRange.
equalizer.setRange(0, 1000)
Decay animation
The equalizer bar includes a decay animation where peaks of values slowly fade over time. This is created by gradually subtracting a set value from the current value of each bar, using a recurring timer.
The frequency of the decay timer (in milliseconds) can be configured using .setDecayFrequencyMs. The default value is 100ms.
equalizer.setDecayFrequencyMs()
Passing 0 will disable the decay mechanism.
On each tick a set value is removed from the current value of each bar. This is configured by using .setDecay. Adjust this based on your equalizer's range of possible values.
equalizer.setDecay(0, 1000)
Purchasing Power Parity
Developers in [[ country ]] get [[ discount.discount_pc ]]% OFF on all books & courses with code [[ discount.coupon_code ]]Bar style configuration
The number of bars to display and the number of segments in the bars/the colours of those bars are defined at startup.
equalizer = EqualizerBar(10, ["#2d004b", "#542788", "#8073ac", "#b2abd2", "#d8daeb", "#f7f7f7", "#fee0b6", "#fdb863", "#e08214", "#b35806", "#7f3b08"])
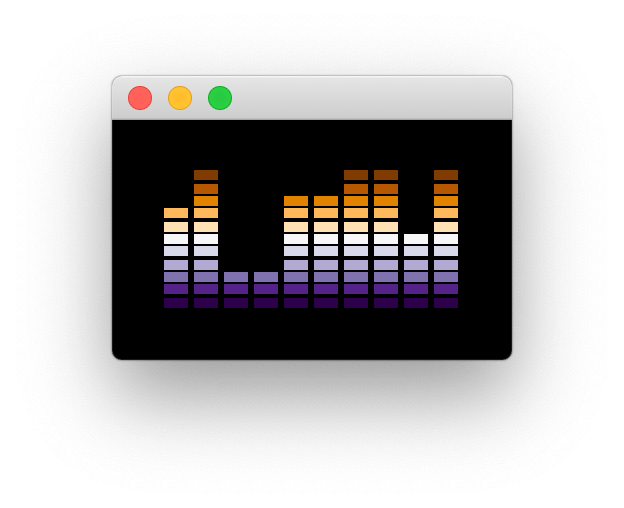 Purple Orange theme with 10 bars
To set the colours after startup, either provide a list of colors (QColor or hex values) at startup, or use the .setColors method. Passing a list of colours to this method will change the number of segments to match the colours provided.
equalizer.setColors(["#810f7c", "#8856a7", "#8c96c6", "#b3cde3", "#edf8fb"])
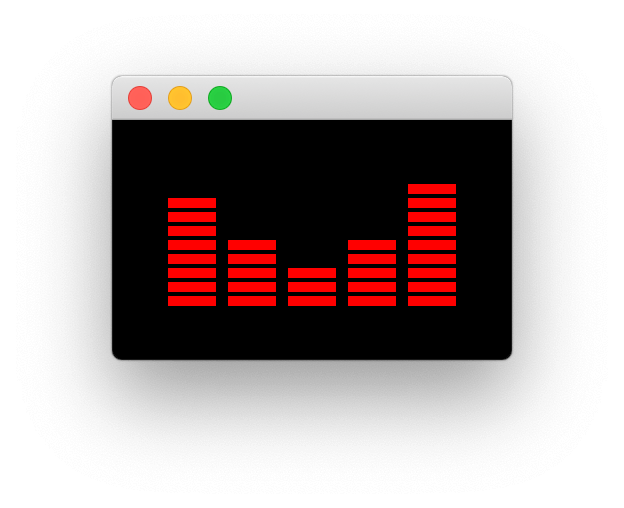
You can also use .setColor to set a single colour for all segments, without changing the number of bars.
equalizer.setColor('red')
The spacing around the equalizer graphic is configured with .setBarPadding providing an integer value to add in pixels.
equalizer.setBarPadding(20)
The proportion of each segment in the bar which is solid/empty is configured using .setBarSolidXPercent or .setBarSolidYPercent with a float value between 0...1.
This can be used to make bar segments thinner and narrower if you prefer.
equalizer.setBarSolidXPercent(0.4)
equalizer.setBarSolidYPercent(0.4)
Finally, the background color can be configured using .setBackgroundColor
equalizer.setBackgroundColor('#0D1F2D')
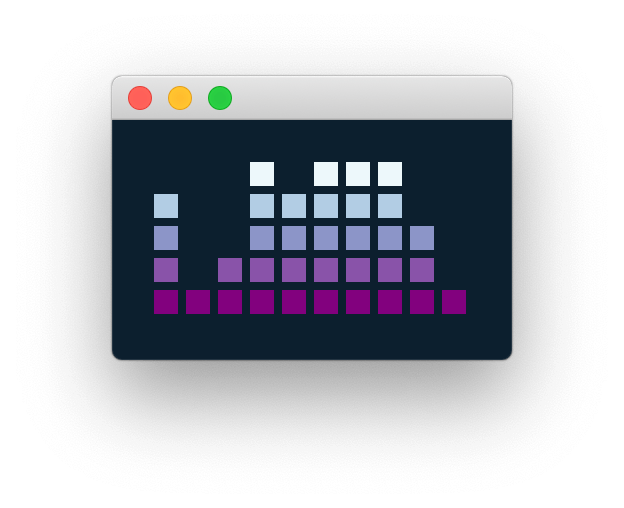 Customising bar padding and sizing.
